Practice Interpreting Data:
|
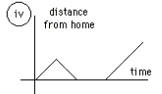
1a. When he just left home he realized he forgot his books. So its number IV.
|
|
|
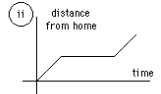
1b. Things went fine until he had a flat tire. Its number II because it shows the line going away from the house and then it stopped and continued (the car had a flat iron)
|
|
|
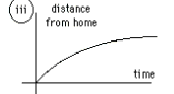
1c. But I sped up... Its number III because the line goes up slow, after the person realized he was going to be late the line starts to move more quick.
|
|
|
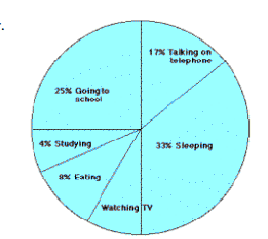
2a. 13% of the day is spent watching TV.
2b. 8 hours are spent sleeping. 2c. Studying takes up the least amount of time just 4%. 2d. Going to school takes a quarter of the day. 2e. Sleeping and going to school are two activities that take up 50% of the day. 2f. Watching TV and talking on the phone takes up 25% of the day. |
|
|
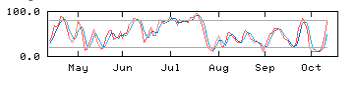
3a. 6 sets of data.
3b. Aproximatelty 25 of may. 3c. By the half of july it reaches its highest. |
|
|
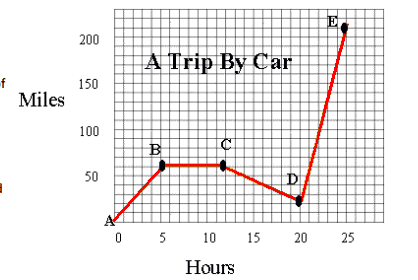
4a. The car traveled 200 miles total.
4b. The average speed is 8 hours per hour. 4c. The car kept its speed the same between 5 and 12. 4d. The direction represented is going down/south. 4e. Approximately 10 hours in the first 2 hours. 4f. Line DE represents the fastest speed. |
|
|
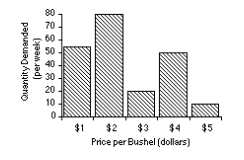
5a. Quantity Demand (per hour) is the dependent variable.
5b. The price of bushel does not necessary always increases with the demand. 5c. The demand of bushel when it costs $5 is 10 per week. |
|
|
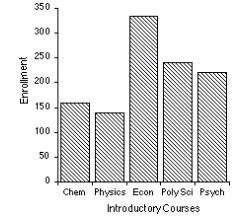
6a. 350 is the total freshmen enrollment.
6b. 43.75% of the students are majoring in physics. 6c. 340 students are enrolled in economics. 6d. 15 more students major in poly than in phys. |
|
|
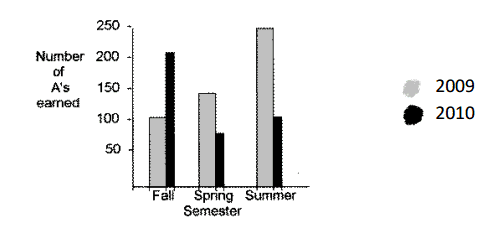
7a. 240 A's total in Fall and Spring 2009.
7b. 285 A's Fall and Spring 2010. 7c. In 2009 more A's were earned. 7d. Summer Semester was the one with most A's. 7e. Spring Semester was the one with fewest A's. |
|
|
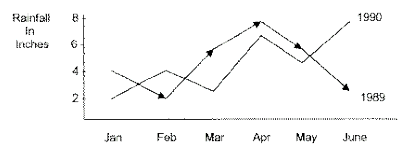
8a. 3 in of rain in Mar 1989.
8b. 2 in more in Feb 1990 than 1989. 8c. 1989 had the most rainfall. 8d. April is the wettest month. |
|
|
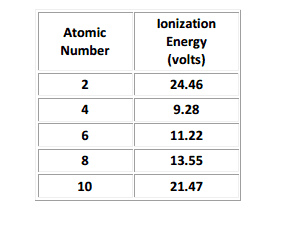
9a. Atomic Number is the independent variable.
9b. Ionization energy is the dependent variable. 9c. 2 elements are represented in the table. 9d. Number 2 has the higher ionization energy. 9e. The shape the graph would produce is a line. |
|
|
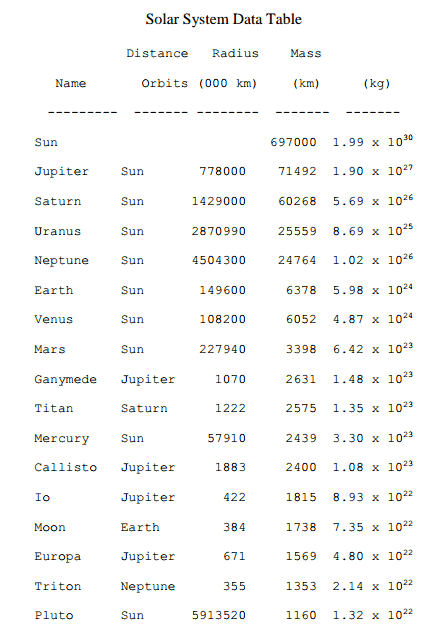
10a. 9 planets are represented in the graph.
10b. 7 moons are represented in the graph. 10c. The moon that has more mass is lo.10d. Venus has the closest radius to the earth. 10e. 0 moons are larger than pluto because it is a planetoid and its bigger. 10f. lo is closest to the planet jupiter. 10g. Venus is the planet closest to the earth. |
|
Practice Making Graphs:
Problem 1
|
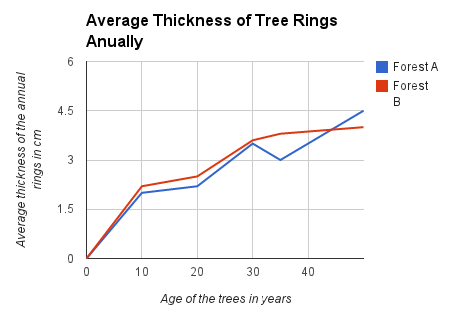
A. Make a line graph of the data.
B. The dependent variable is Average thickness of the annual rings(cm) C. The independent variable is Age of trees in years. D. 3.5 is the average thickness of the annual rings of 40 year old trees in Forest A. E. Based on this data, what can you conclude about Forest A and Forest B? |
|
|
Problem 2
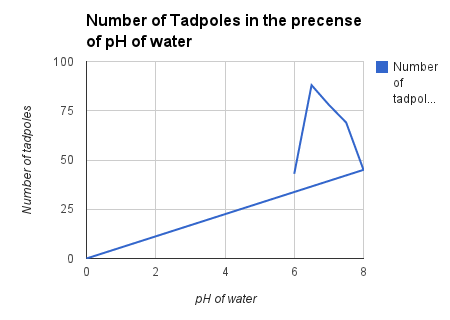
A. Make a line graph of the data
B. Number of Tadpoles is the dependent variable. C. pH of water is the independent variable. D. The average pH in this experiment is 8. E. The average number of tadpoles per sample is 80. F. The Optimum water pH for tadpole development is 6.5 G. Between numbers 6 and 7 is the greatest change in tadpole number H. Approximately 50 tadpoles I would you expect to find water with a pH reading of 5. |
|
|
Problem 3
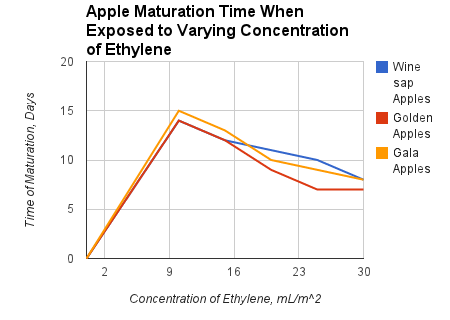
A. Make a line graph of the data.
B. The dependent variable is Time of Maturation, Days. C. The independent variable is the Concentration of Ethylene, mL/m^2. |
|
Extra Credit Graphs
|
|
